Daten-Visualisierung mit Python3 und pylot, pandas, folium und seaborn
Die folgenden, kleinen Python-Scripts zeigen, wie man in Python mit wenig code
Daten-Visualisierung betreiben kann.
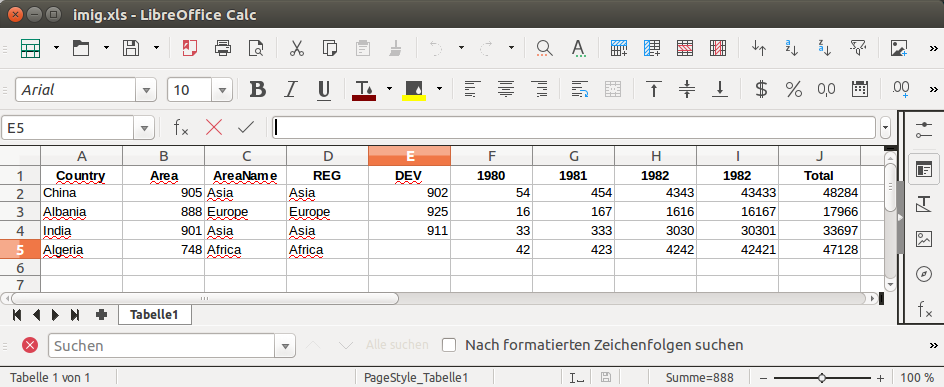
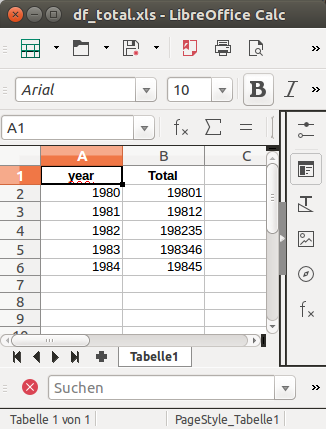
Manche Scripte lesen mit pandas spreadsheets ein, die hier dargestellt sind:
|
|
|
imig.xls
|
df_total.xls
|
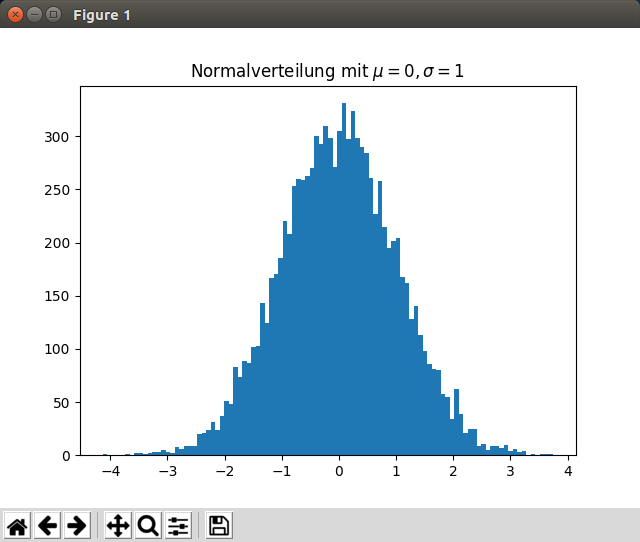
import matplotlib.pyplot as pyplot
import numpy

x = numpy.random.randn(10000)
pyplot.hist(x, 100)
pyplot.title(r"Normalverteilung mit $\mu=0, \sigma=1$")
pyplot.savefig("normal.png")
pyplot.show()
|
|
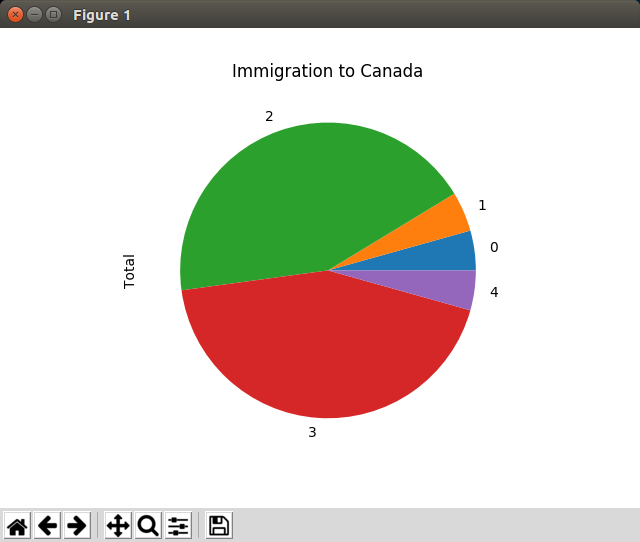
# use_pandas.py
import matplotlib as mpl
import matplotlib.pyplot as plt
import pandas

df_can = pandas.read_excel("df_total.xls")

df_can['Total'].plot(kind='pie')
plt.title(r'Immigration to Canada')
plt.show()
|
|
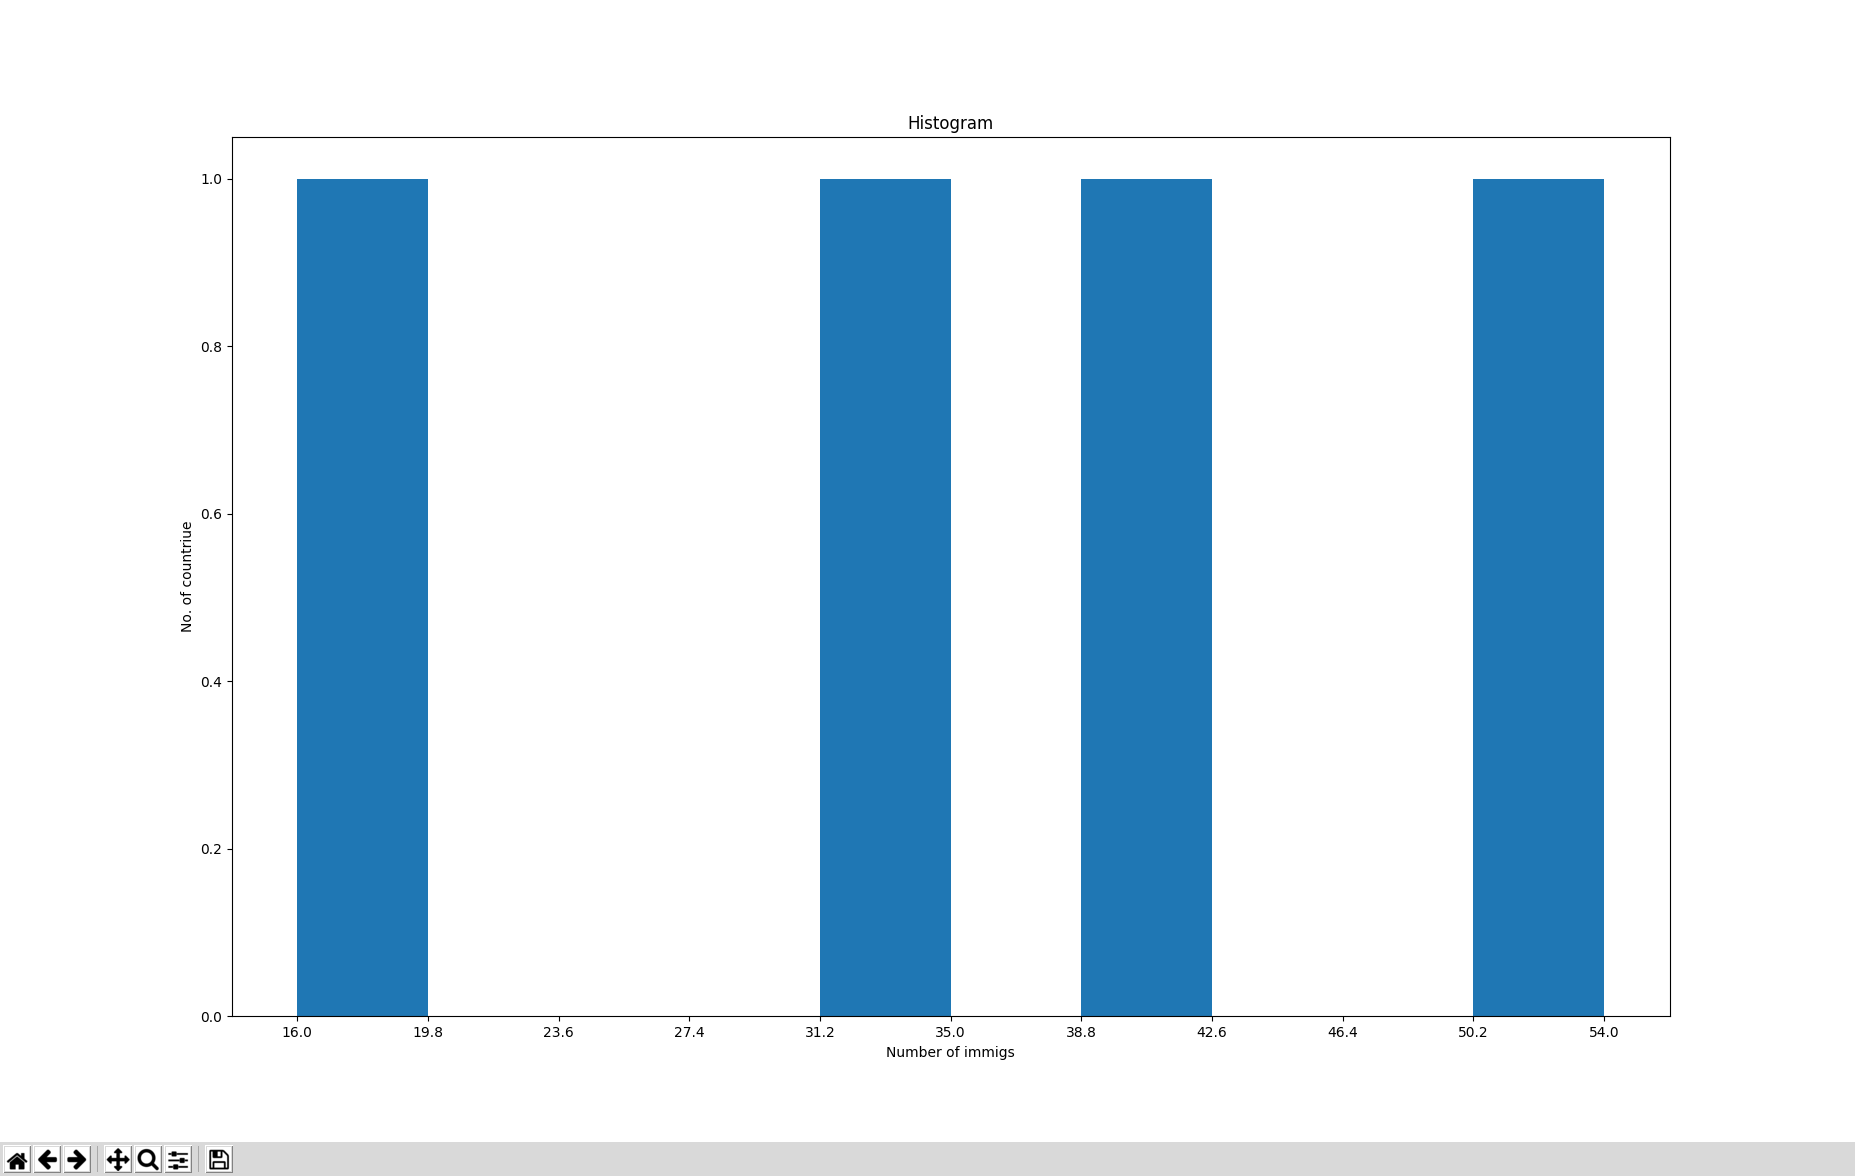
# use_pandas_hist.py
import matplotlib as mpl
import matplotlib.pyplot as plt
import numpy as np
import pandas

df_can = pandas.read_excel("imig.xls")

count, bin_edges = np.histogram(df_can[1980])

df_can[1980].plot(kind='hist', xticks=bin_edges)
#df_can[1980].plot(kind='hist')

plt.title("Histogram")
plt.xlabel("Number of immigs")
plt.ylabel("No. of countriue")
plt.show()
|
|
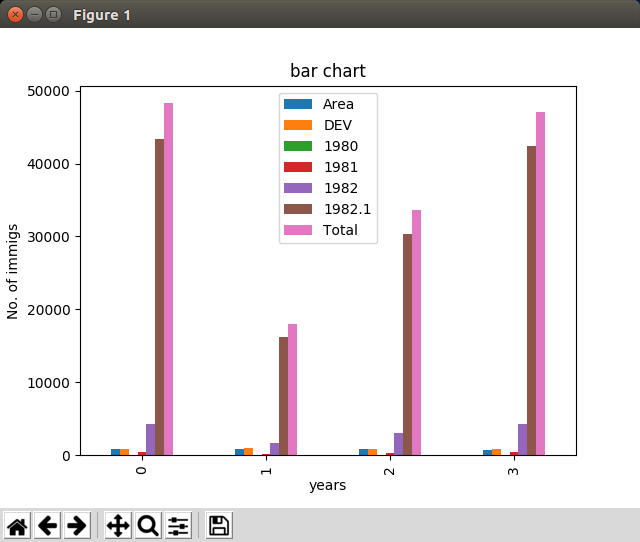
# use_pandas_bar.py
import matplotlib as mpl
import matplotlib.pyplot as plt
import pandas

df_can = pandas.read_excel("imig.xls")
years = list(map(str, range(1980, 1982)))

df_can.plot(kind='bar')

plt.title("bar chart")
plt.xlabel("years")
plt.ylabel("No. of immigs")
plt.show()
|
|
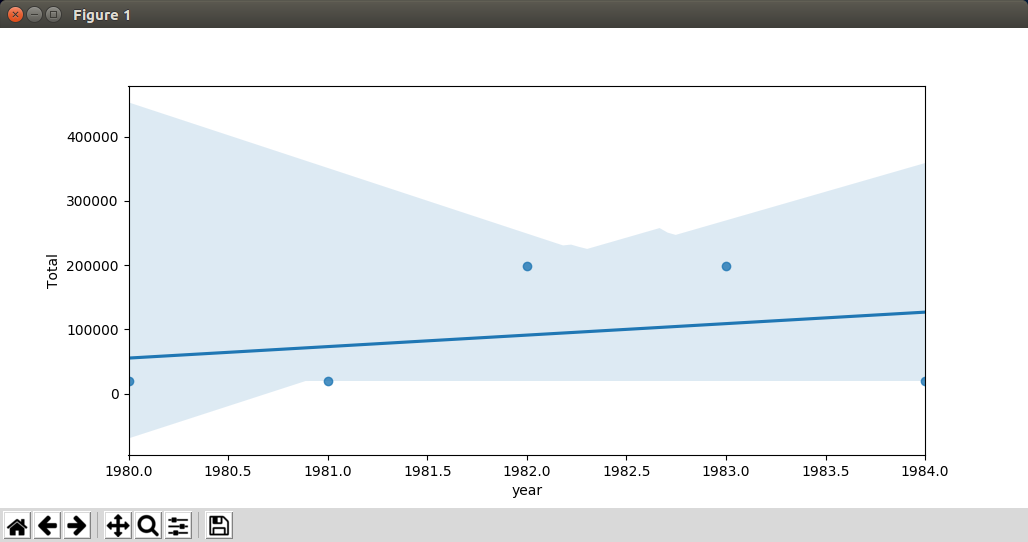
# use_pandas_seaborn.py
import matplotlib.pyplot as plot
import pandas
import seaborn as sns

df_total = pandas.read_excel("df_total.xls")

ax = sns.regplot(x='year', y='Total', data=df_total)

plot.show()
|
|
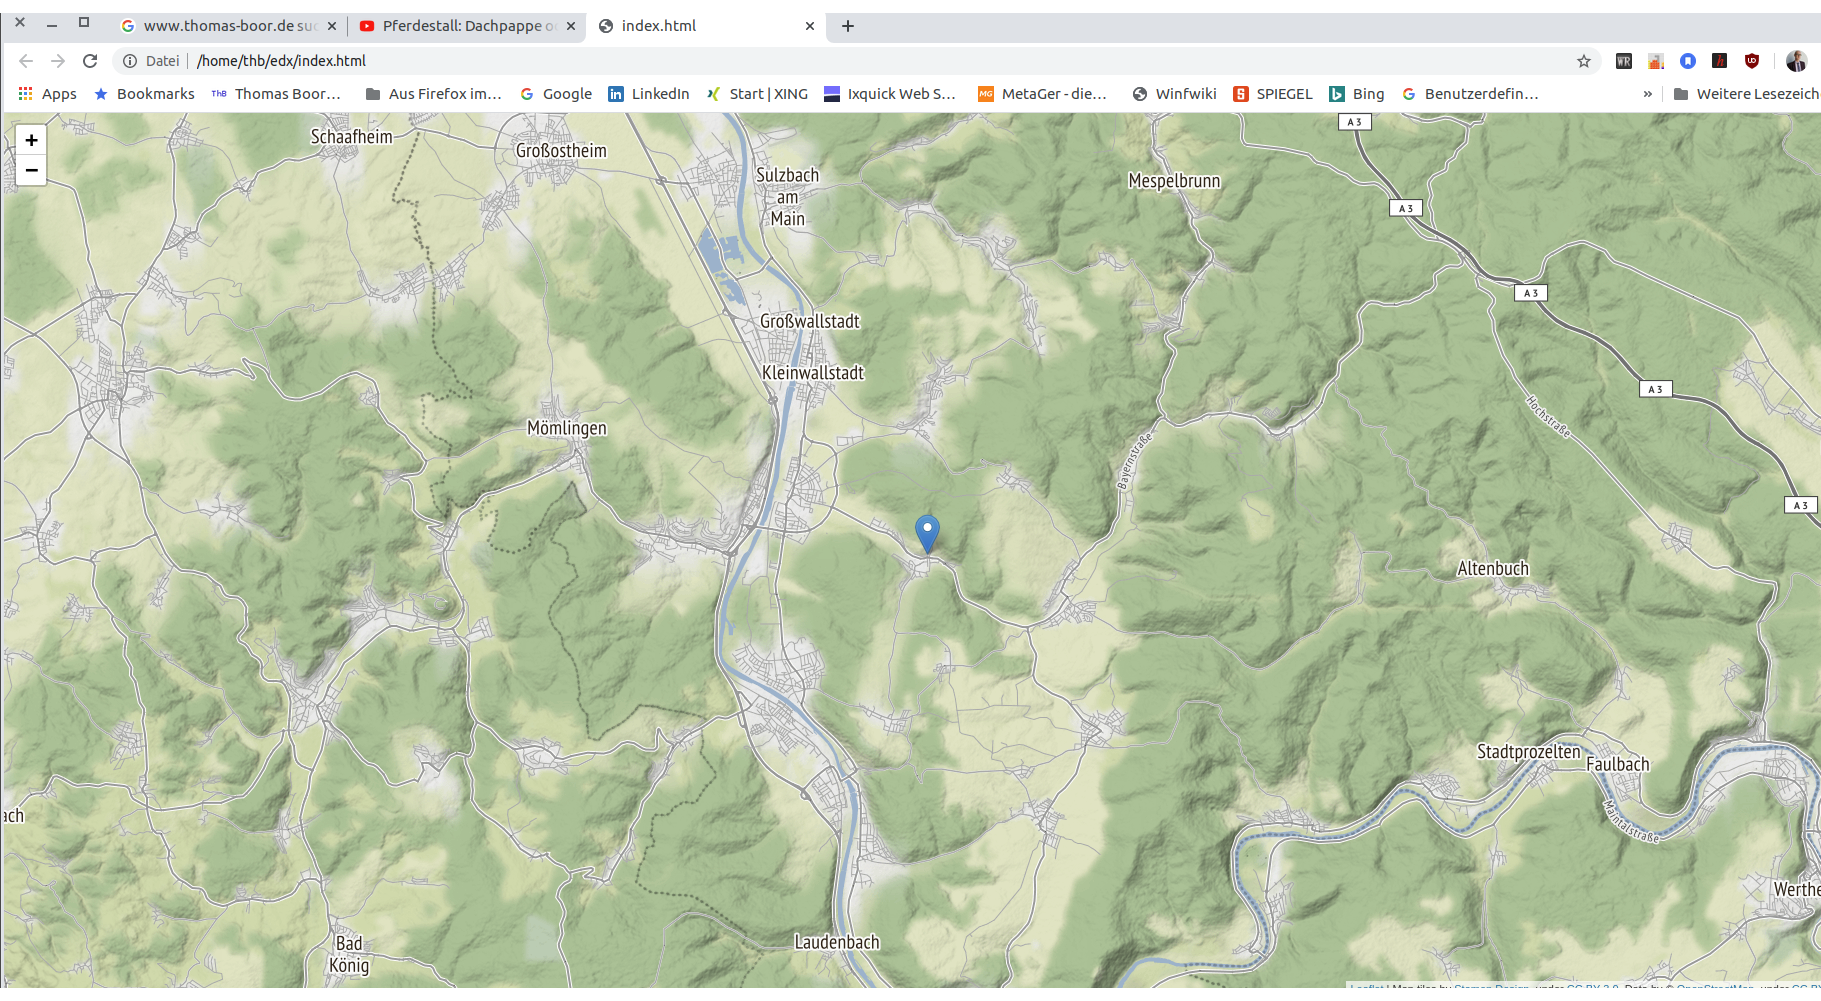
import folium
import matplotlib.pyplot as plot
import webbrowser, os

m = folium.Map(location=[49.8313889, 9.2069444],
			   zoom_start=12,
			   tiles='Stamen Terrain')

elsenfeld = folium.map.FeatureGroup()

#elsenfeld.add_child(folium.features.CircleMarker([49.8313889, 9.2069444], radius=5, color="red", fill_color="yellow"))

m.add_child(elsenfeld)

folium.Marker([49.8313889, 9.2069444], popup="Elsenfeld-Rück").add_to(m)

url = 'index.html'
m.save(url)
webbrowser.open(url)
|
|
|